Where data comes from for data-driven decision making
It’s easy to say you need (more) data in order to understand what’s going on and make decisions. But where does all of this data come from?
In this post, I’ll start with an everyday example – and a spurious correlation – before digging deeper into the nature of data.
Do correlations and big data give us answers and insights?
Has it ever occurred to you that you could be headed to a bizarre and macabre death caused by getting tangled in your bedsheets, and that controlling our collective cheese consumption could be the thing that saves you from that fate?
This is something you might be able to “answer” (notice those scare quotes) by checking in with big data sources like the United States Department of Agriculture (USDA) and Centers for Disease Control and Prevention (CDC).
Per capita cheese consumption correlates with the number of people who died by getting tangled in their bedsheets.
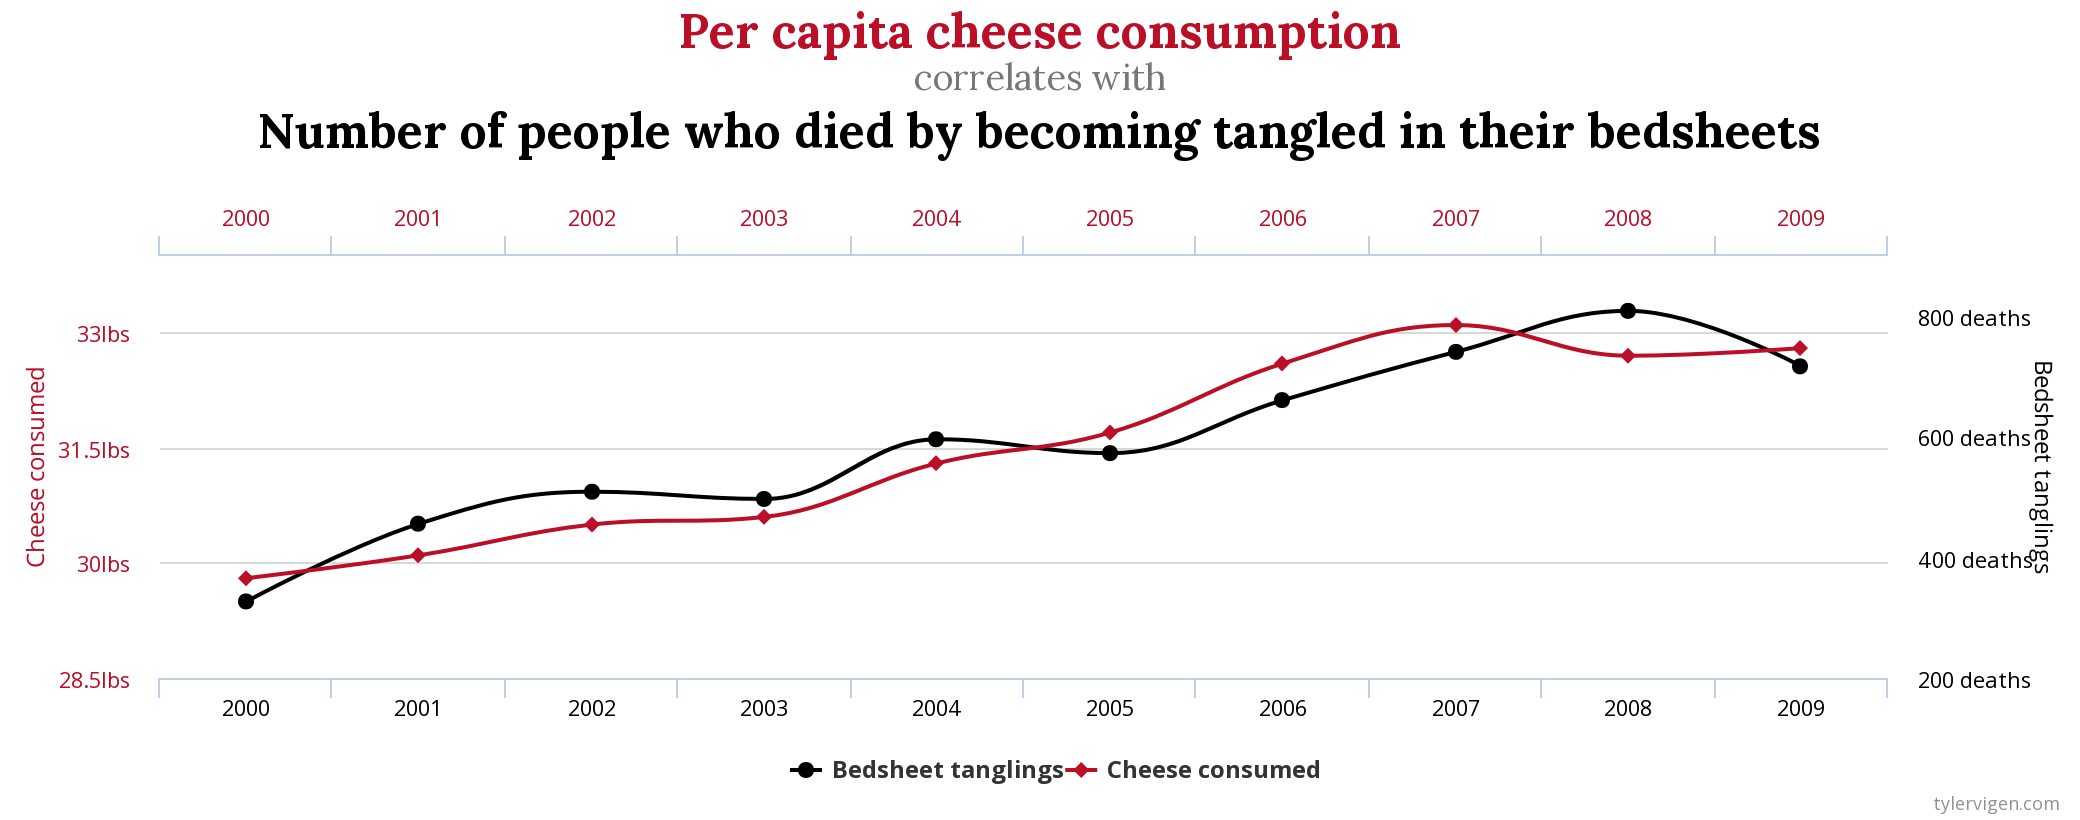
But that’s not really a thing. It’s a spurious correlation – factors whose variation makes it appear that they’re related to each other, even though they’re not. And it highlights why being able to get a number or plot a graph might not be giving you the business insight you think it is.
This might sound like something that just needs better math to sort out, but really, this problem is rooted in the very nature of data, and complicated by the very human nature of decision-making.
(You can watch the video version of this post, or keep reading below.)
How is data created?
Let’s look at how data is created and used in the context of your strategy.
All strategies start with a vision of what you’re interested in doing or achieving, or where you want to go, which you translate into some measurable and trackable goals. In other words, you’ve determined some pathways to achieving your vision, and you’ve got some signposting and accountability in place. Using data strategy to support this means that you’ve determined specific data that you can collect that will give you relevant clues about the context of your decisions and your progress along the pathways, and that you’re recording that data in a systematic way with the intention of using it to support decision-making, including assessing, deciding on, and maybe even revising your pathways to your vision. Sounds pretty standard, right? But it doesn’t really capture how this gets implemented.
For implementation, you need to answer questions not only about what to record, but also what you’re going to look at and use in various situations.
What are you recording and calculating?
In determining what to record, you’ve simplified a pretty complex world into a set of easy-to-use variables or clues that make up your raw data.
In the case of our spurious example, we’ve reduced the world to the annual supply of cheese in the US, the population of the US, and the causes of death as classified and recorded by the CDC. Note that even our calculation for per capita consumption is a rough estimate based on the supply divided by the population. That’s not an actual measure of what was consumed.
Similarly, when you record client data for a CRM, you’re simplifying a pretty complex human being to a set of easy to record fields, like name, zip code, gender, and how you acquired that client, and you simplify your client’s history with you to data such as revenue from a purchase and date of purchase. Then you aggregate it all into calculations for things like Customer Lifetime Value to approximate how much money you think you can expect from a single customer going forward, on the assumption that this simplification adequately captures everything you need to know.
So your data is a simplified representation or model of things in the real world. And your calculations, your mathematical models, are approximations.
How do you make data digestible and usable?
Now, even though you’re simplifying the world, you’ll still end up with too much data to just look through for insights.
So you classify that data, aggregate that data, and create stories about that data so that it’s more digestible and usable for decision-making.
In other words, you explore and analyze and curate.
If you download the USDA cheese data used for our spurious example, you’ll see that what was charted is the total of the so-called “natural” cheeses. According to the USDA classifications, a lot of processed cheeses are made from natural cheeses, so we can’t just add them in or look at just the processed cheeses, because there’s no good way to tell them apart. At least, not with this data. So we ignored it.
We curate like this all of the time, like when you define a classification system, which, overall, really is a good thing, or when you chart data together to show a trend, or when you juxtapose charts on dashboards, with the thought that these things all make more sense in the context of the other things, or should be interpreted in the context of the other things.
So, the nature of data – a simplified model of the world – is already interrelated with human decision-making – how to simplify and curate. But it doesn’t end there.
Human Brains, Data, and Decision Making
In looking at our data as part of strategic decision-making, or talking about ourselves as data driven or assisted or informed, we’re not giving credit to all of the things we’re recording just in our memories that are also playing a part in our decision making, such as:
- our perception of things that have and haven’t worked before, or
- the relative importance of a certain event in the grand scheme of things, or
- how much I love cheese and am invested in a pathway that lets me keep it.
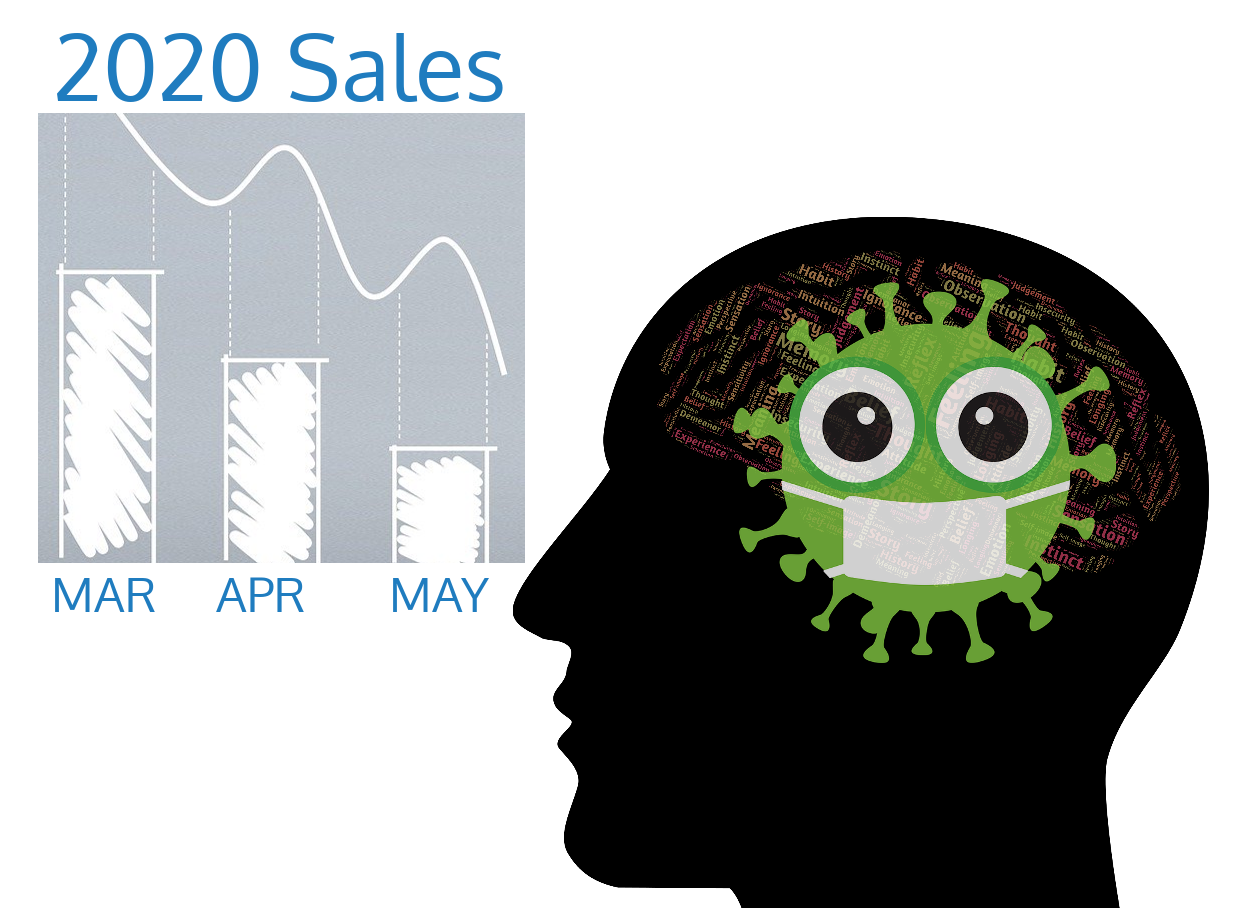
In the case of the CRM, if all you were looking at is the data we already discussed, how would you determine a reason for the dip in sales in 2020 during the pandemic? You would do this by bringing in other things you know about the world, things that aren’t in your data, and things you’re probably not recording as part of your decision-making, because they’re just too obvious.
With all of the simplifying and curating, and all of our memories and biases coming together, it can be easy to get nudged off course, a little a time, until you’re heading in the wrong direction.
How are you expected to tell the difference between your data helping you achieve your goals, and your data tricking you into giving up on cheese and bedsheets unnecessarily?
In some instances, you rely on what “authorities in the field” tell you to record and how to use it. Your CRM is a good example. CRM software frequently provides a standard list of fields for you to fill out, as well as some rudimentary analyses to get you started.
In other instances, you’re relying on experience and following your intuitions about what makes sense at the time.
Whatever the case, you’re learning and experimenting with what you need to pay attention to and how. At the foundation of all of this, it’s important that
- you’re clear on your vision
- you’re clear on your goals and how they’ll help you move the needle towards your vision
- you know what data you have, how it was collected, and how it can and cannot be used in various situations (because all of that simplifying and curating means some details have inevitably been left out, and those might really matter in certain situations)
- you’ve got a way to record and review your big decisions so you can turn your decision-making process into data you can audit (and use to either stay the course or inform/tweak your data collection, data analysis endeavors, and resulting actions)
Where does your data come from?
Have you ever been misled by a spurious correlation?
How have you simplified a complex thing or phenomenon in the real world? How has that made your days more efficient and your decisions easier to make?
Want some help with your data project, such as figuring out what to record or how to use what you have? Let’s connect!